Golang memory leak investigation using prometheus
1. introduction
Memory allocation works pretty much the same way a hotel does. A person reserves a room. Only said person can use the room. After the person is done using the room, he/she will notify reception, and they will clean it up and make it available for the next person. This is similar to how applications request memory from the kernel. The problem arises when the application doesn’t notify the kernel when it’s done using the memory. The kernel cannot give this memory to other applications who ask for it, And that’s what’s is called a memory leak.
2. How everything started
It was the end of the week. I was just finishing up some work before calling it a day. While thinking of the best way to catch up on sleep during the weekend, I decided to do some checks just to make sure that everything is running normal.
$ sudo podman stats --no-stream --no-reset
ID            NAME        CPU %       MEM USAGE / LIMIT  MEM %       NET IO             BLOCK IO           PIDS        CPU TIME            AVG CPU %
8d88706ca67b  api         4.84%       1.896GB / 8.052GB  23.54%      14.51GB / 21.4GB   29.25GB / 508MB    6           4h30m53.868811376s  4.84%
And that’s how you know that the weekend plans are ruined. This container is supposed to take 40 MB of memory not 1.9GB. Which means that somewhere in this application, memory is allocated but not freed. So we need to know how and when does this happen.
3. The importance of instrumentation
In a production environment, It’s important to monitor and measure the performance and resource utilization of an application. It’s impossible to improve what cannot be measured. So in our case, We need to know how and when the memory jumped from 48 mb to 1.9GB.
We can achieve this by using Prometheus. Prometheus is an open-source systems monitoring and alerting toolkit originally built at SoundCloud. The way it works is we will install an exporter in our application. Prometheus will regularly use this exporter to fetch metrics about our application.
Since Prometheus is built in Go, There is already an exporter builtin which will provide information from the go runtime about the number of goroutines, the memory usage…etc.
import (
	...
	"github.com/prometheus/client_golang/prometheus/promhttp"

)
func main() {
	...
    go func() {

        http.Handle("/metrics", promhttp.Handler())

        fmt.Println(http.ListenAndServe(":6060", nil))

    }()
}
we need to import the promhttp handler and register the handler in the default http server.
after running the application, we can test if we can access the metrics.
$ curl http://127.0.0.1:6060/metrics
# HELP go_gc_duration_seconds A summary of the pause duration of garbage collection cycles.
# TYPE go_gc_duration_seconds summary
go_gc_duration_seconds{quantile="0"} 9.5699e-05
go_gc_duration_seconds{quantile="0.25"} 0.000150573
go_gc_duration_seconds{quantile="0.5"} 0.000182449
go_gc_duration_seconds{quantile="0.75"} 0.000222511
go_gc_duration_seconds{quantile="1"} 0.013128995
go_gc_duration_seconds_sum 0.795485422
go_gc_duration_seconds_count 2819
# HELP go_goroutines Number of goroutines that currently exist.
# TYPE go_goroutines gauge
go_goroutines 10
# HELP go_info Information about the Go environment.
# TYPE go_info gauge
go_info{version="go1.19.1"} 1
# HELP go_memstats_alloc_bytes Number of bytes allocated and still in use.
# TYPE go_memstats_alloc_bytes gauge
go_memstats_alloc_bytes 1.0551832e+07
# HELP go_memstats_alloc_bytes_total Total number of bytes allocated, even if freed.
# TYPE go_memstats_alloc_bytes_total counter
go_memstats_alloc_bytes_total 1.053519564e+10
# HELP go_memstats_buck_hash_sys_bytes Number of bytes used by the profiling bucket hash table.
...
As you can see now we can view the metrics about our application. The following are some metrics that can be useful for diagnosing memory issues:
- go_goroutines: Number of goroutines that currently exist. Goroutines are lightweight threads managed by the Go runtime. Monitoring this metric helps track the concurrent execution of code in your Go application.
- go_memstats_alloc_bytes: Number of bytes allocated and still in use. This metric provides insight into the current memory usage of the application, specifically the amount of memory that has been allocated and is still in use.
We can configure Prometheus to automatically fetch these metrics and monitor our application over time.
$ sudo cat /etc/prometheus/prometheus.yml

  - job_name: 'prometheus'
    scrape_interval: 10s
    static_configs:
      - targets: ['127.0.0.1:6060']
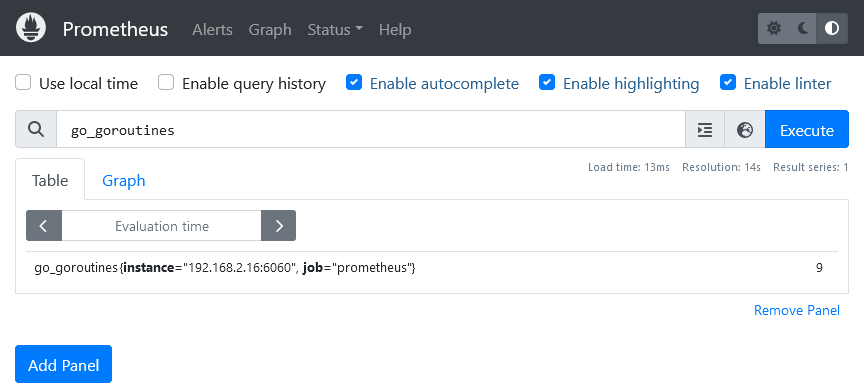
After some time we can view the metrics in Prometheus. We can view the number of goroutines for example using the following.
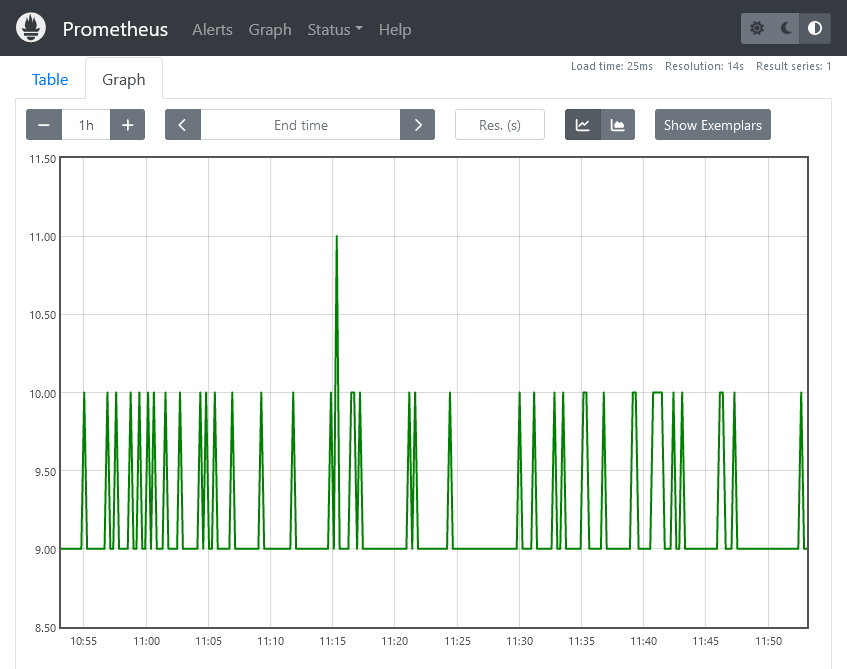
we can also view a graph for the change of this value over time
We will restart our app, and wait until the memory is high, then check Prometheus to diagnose how memory usage increases over time.
$ sudo podman container restart api
$ sudo podman stats --no-stream --no-reset
ID            NAME        CPU %       MEM USAGE / LIMIT  MEM %       NET IO             BLOCK IO           PIDS        CPU TIME             AVG CPU %
8d88706ca67b  api         2.22%       18.19MB / 8.052GB  0.23%       308.9kB / 185.9kB  106.5kB / 0B       6           268.490162ms         2.22%
4. Diagnosing the issue
After running the application for a couple of hours. I was checking regularly to see if the memory usage increased. The surprising thing was that it was still using a few megabytes only. I tried to use application extensively, but still the memory was not increasing beyond normal.
The next day I logged in again to check.
$ sudo podman stats --no-stream --no-reset
ID            NAME        CPU %       MEM USAGE / LIMIT  MEM %       NET IO             BLOCK IO           PIDS        CPU TIME            AVG CPU %
8d88706ca67b  api         5.50%       1.62GB / 8.052GB   20.12%      78.55MB / 110.9MB  6.365MB / 451.7MB  6           1m40.073521859s     5.50%
looks like the memory usage increased over night. So let’s check Prometheus to see when it did increase exactly
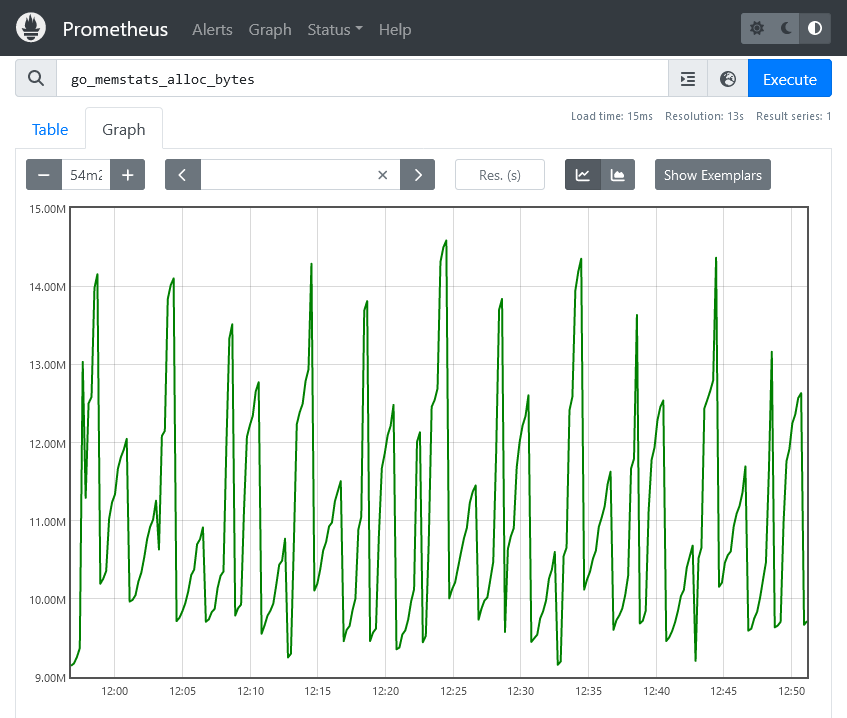
Huh !! so the memory usage is withing normal in Prometheus. Which means that the memory consumed by the application ,as a whole, stayed the same over night. So why is podman stats showing a different output ? I tried to think of all possible scenarios that could make this happen. The number of users at night is very low, So the chance of this being caused by normal user behavior is very slim. The only thing that runs at night is the backup cron job. The backup just uses tar to archive a few folders inside the container. So I decided to run the backup script and check if there is any change.
$ sudo podman stats --no-stream --no-reset
ID            NAME        CPU %       MEM USAGE / LIMIT  MEM %       NET IO             BLOCK IO           PIDS        CPU TIME            AVG CPU %
8d88706ca67b  api         0.00%       2.873GB / 8.052GB  35.68%      151.1MB / 212.4MB  16.26MB / 580MB    6           3m31.566104384s     6.05%
Ahuh !! so the backup job is the culprit. Let’s check the overall memory utilization of the machine.
$ free -h
              total        used        free      shared  buff/cache   available
Mem:          7.5Gi       1.1Gi       190Mi       434Mi       6.2Gi       5.7Gi
Swap:         8.0Gi       235Mi       7.8Gi
Wait a second, only the buff/cache is high. The page cache is a part of the system’s memory that is dedicated to caching pages of files and directories. It is used to speed up file access by keeping frequently used data in RAM. When you read or write to a file, Linux often loads the data into the page cache. Subsequent reads or writes to the same data can then be serviced from RAM instead of accessing the slower disk. So this cache can be cleared when the system needs that memory back. So does this mean podman includes cache memory when reporting stats ? I checked docker documentation for the same stats command. the documentation says
On Linux, the Docker CLI reports memory usage by subtracting cache usage from the total memory usage.
But there is no mention of anything similar in podman documentation.
to verify We need to clear the system cache and check if this will affect the podman stats.
$ sudo sh -c 'echo 1 > /proc/sys/vm/drop_caches'
let’s see the overall memory of the machine
$sudo free -h
              total        used        free      shared  buff/cache   available
Mem:          7.5Gi       1.1Gi       336Mi       433Mi       6.1Gi       5.7Gi
Swap:         8.0Gi       237Mi       7.8Gi
$ sudo sh -c 'echo 1 > /proc/sys/vm/drop_caches'
$ sudo free -h
              total        used        free      shared  buff/cache   available
Mem:          7.5Gi       1.1Gi       5.6Gi       433Mi       834Mi       5.7Gi
Swap:         8.0Gi       237Mi       7.8Gi
Now that we cleared the cache let’s check if the output for podman stats changed.
$ sudo podman stats
ID            NAME        CPU %       MEM USAGE / LIMIT  MEM %       NET IO             BLOCK IO           PIDS        CPU TIME             AVG CPU %
8d88706ca67b  api         5.62%       22.44MB / 8.052GB  0.28%       269.3MB / 380.4MB  24.22MB / 584.2MB  6           5m47.360507426s      5.62%
Ahuh! this proves my point that podman confuses cache memory with real memory utilization. So I opened an issue in Github for this #1642, and after some time the maintainers fixed this issue in #1643.
5. Conclusion
In the world of coding, memory leaks are a serious issue that can bring even the biggest servers to a halt. Prometheus can helps us catch these memory leaks By always watching over our software. By keeping an eye on metrics such as go_memstats_alloc_bytes, we can find and fix memory leaks before they cause big problems. Just remember, it’s not a one-time thing; we have to keep checking regularly.